
Healthy Financial Forecasting
We use a ‘beyond budgeting’ approach to get a true view on what the future holds in our business.
In the previous blog posts in this series, I discussed how healthy agency finances work, and the simple finance dashboard we’ve developed.
In the last post I mentioned that our dashboard is a graphical representation of our forecast, rather than simply reporting last month’s figures, so this time I’m going to explain how we forecast our finances.
Forecasting Principles
In most businesses, the financial forecast is actually a mash-up of multiple things:
- budgeting for the allocation of resources during the year (aiming to keep costs down, usually)
- setting aspirational targets for sales (hoping to drive the sales team)
- convincing shareholders/investors/other stakeholders that everything is just fine
Each of which doesn’t actually help with getting a useful forecast to plan for what course the business is actually on, and being able to discuss it and decide on actions to take.
We’ve adopted some of the Beyond Budgeting approach (worth doing some wider googling to read up on this too) so that our forecast is a genuine forecast.
That means we treat it like a weather forecast: it is a regularly-updated view on what we think is going to happen, based on the latest data we have combined with our experience and best judgement.
If the weather forecast in the UK told you what you wanted to hear every day and said it was going to be 28 degrees and sunny, it wouldn’t be very useful, would it? At the same time, if it tried to browbeat you into being overcautious and wearing your full ski gear to go out every day, you’d also quickly give up on it.
But everyone knows that weather forecasts aren’t right all the time. We know they are simply forecasts: best guesses with available information and current models.
There’s no point in just doing a weather forecast at the start of each year, and it’s the same with financial forecasts. As new data is gathered, new market or economic information, the forecast needs to be updated.
Forecasting Method
We have a simple Google spreadsheet that we use (in the same spreadsheet as our dashboard).
As we approach each new financial year we do the first forecast for the full year, entering monthly guesses in the sheets for forecast income and forecast expenditure.
That then results in the data being shown in a summary forecast sheet:
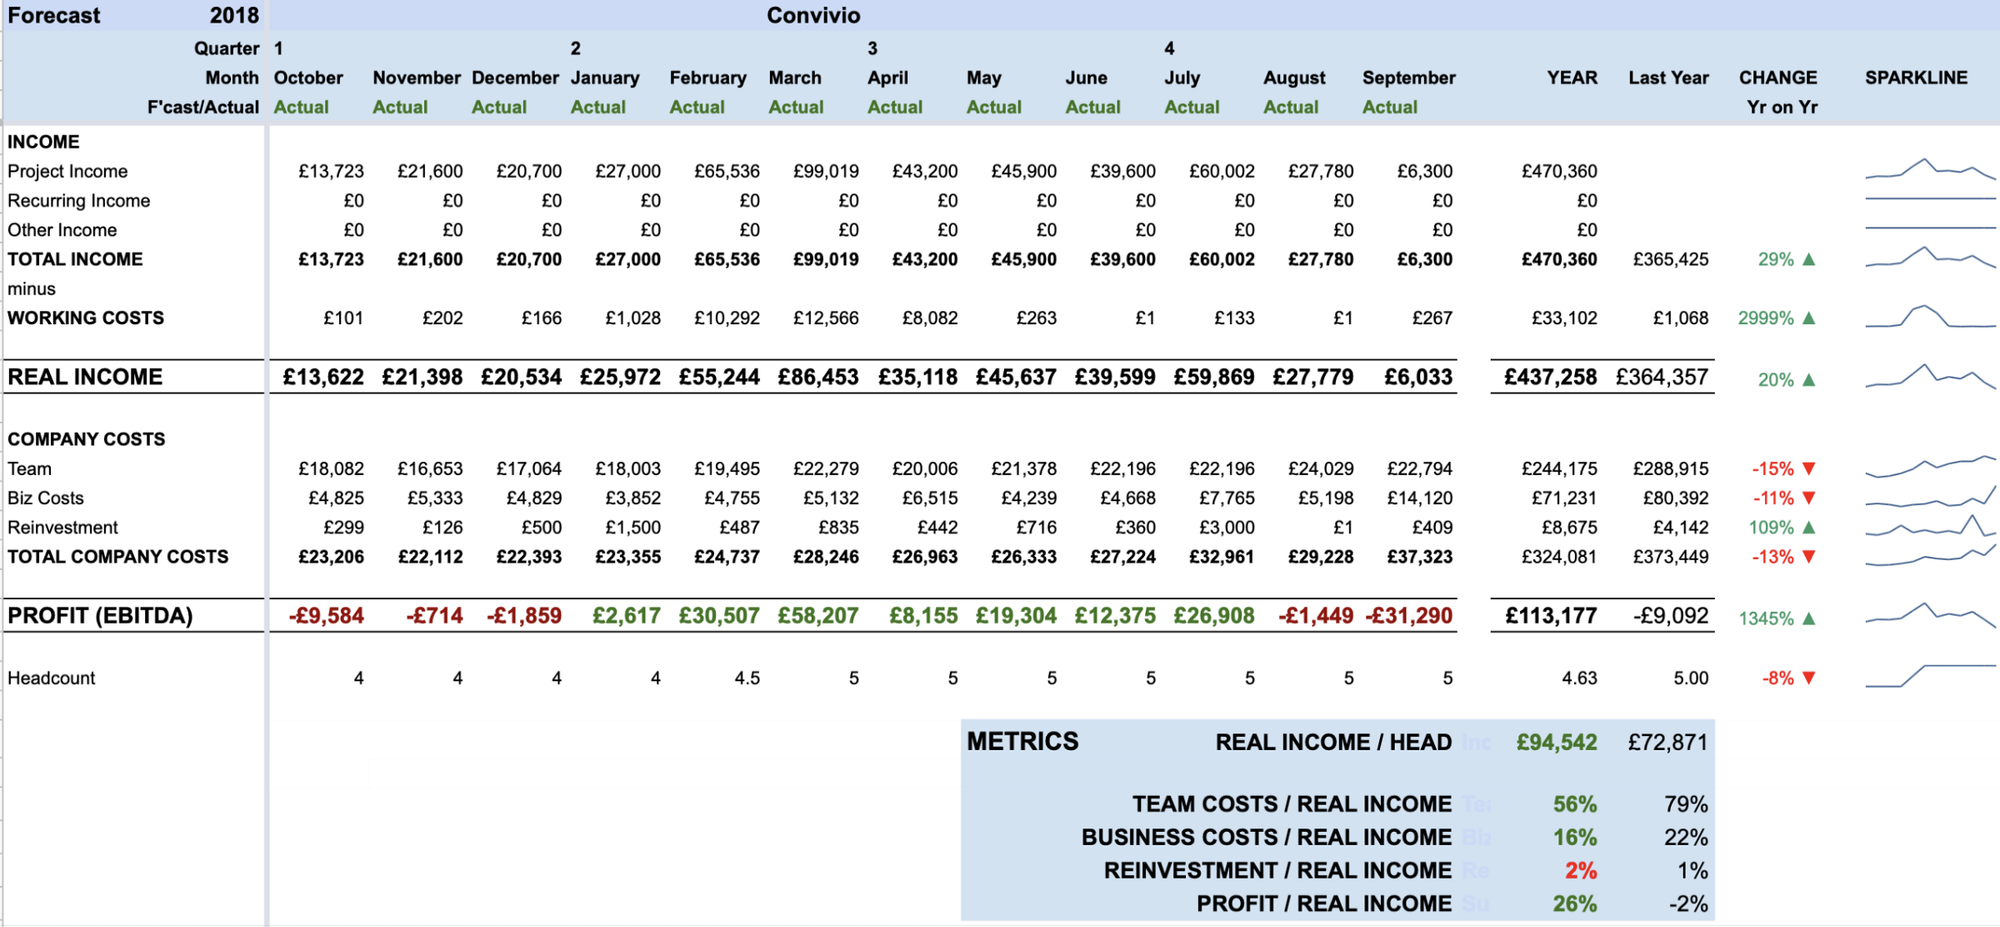
Every month we update the income and expenses sheets with the ‘actual’ data, and then update the forecast for the coming months with any new information.
In the spreadsheet above you can see our forecast at the end of our financial year last year, so all the months are shown as ‘Actual’. (You can also read the blog post I wrote explaining our financial results in detail)
This sheet is mainly intended to be reviewed by the management of the business (but in Convivio everyone can see it — including you!). Therefore it highlights things that are useful starting points for discussion in management meetings:
- months where there are losses (highlighting the existence of that rollercoaster effect I mentioned in the first post in this series, which is typical in small agencies but needs to be watched carefully)
- comparison with last year
- trends up or down on last year
- ‘sparkline’ graphs to see any blips or trends to look at in the numbers
- performance against the metrics for running a healthy and balanced agency, as described in the first blog post in this series
This means the key information for the management team to discuss about the finances of the business is visible on one screen at the same time.
Monitoring Progress
So we know the current forecast for the business, and that’s really useful. But what is even more useful is to understand changes in our forecast over time —as we make it more accurate by updating it each month, what is the trend?
For this we have a simple sheet (also in the same spreadsheet) in which we enter the key data from the forecast after updating it each month, and we’ve also set our simple goals for the year:
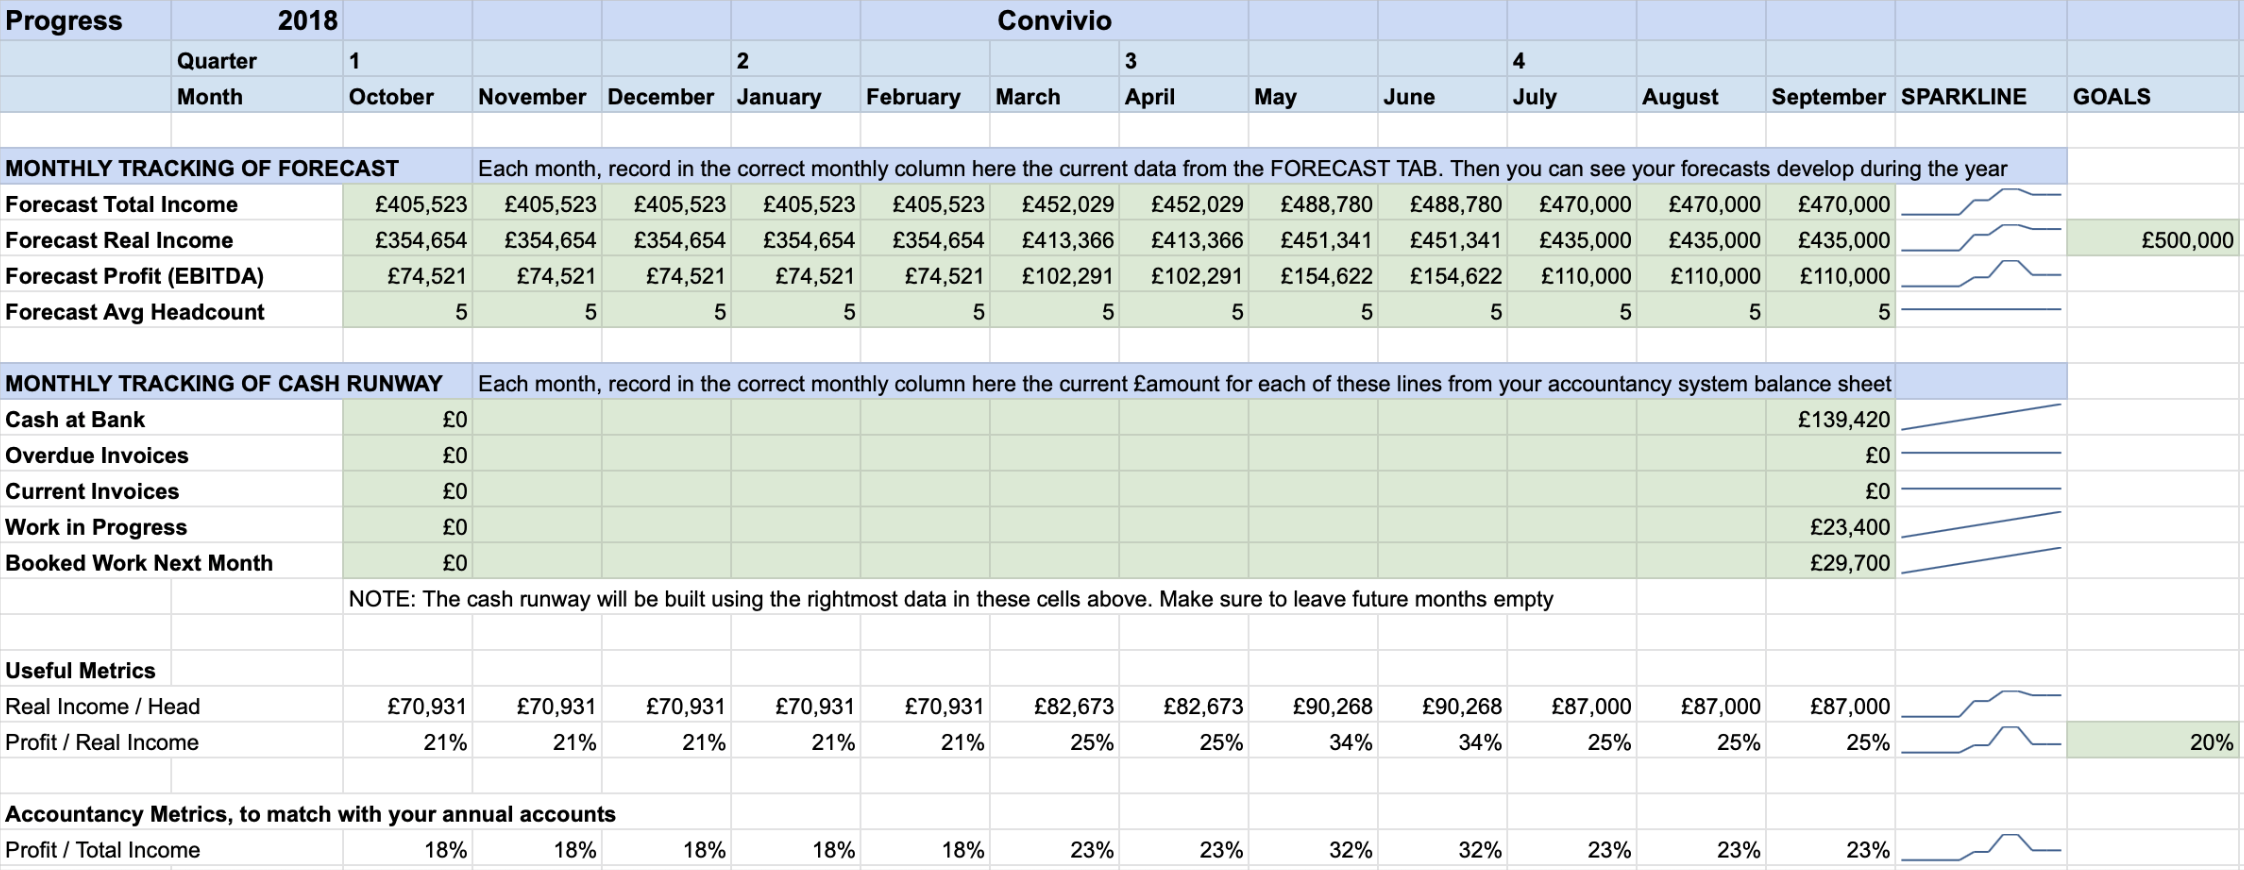
That then allows us to see the trends in our forecast updates on our dashboard:
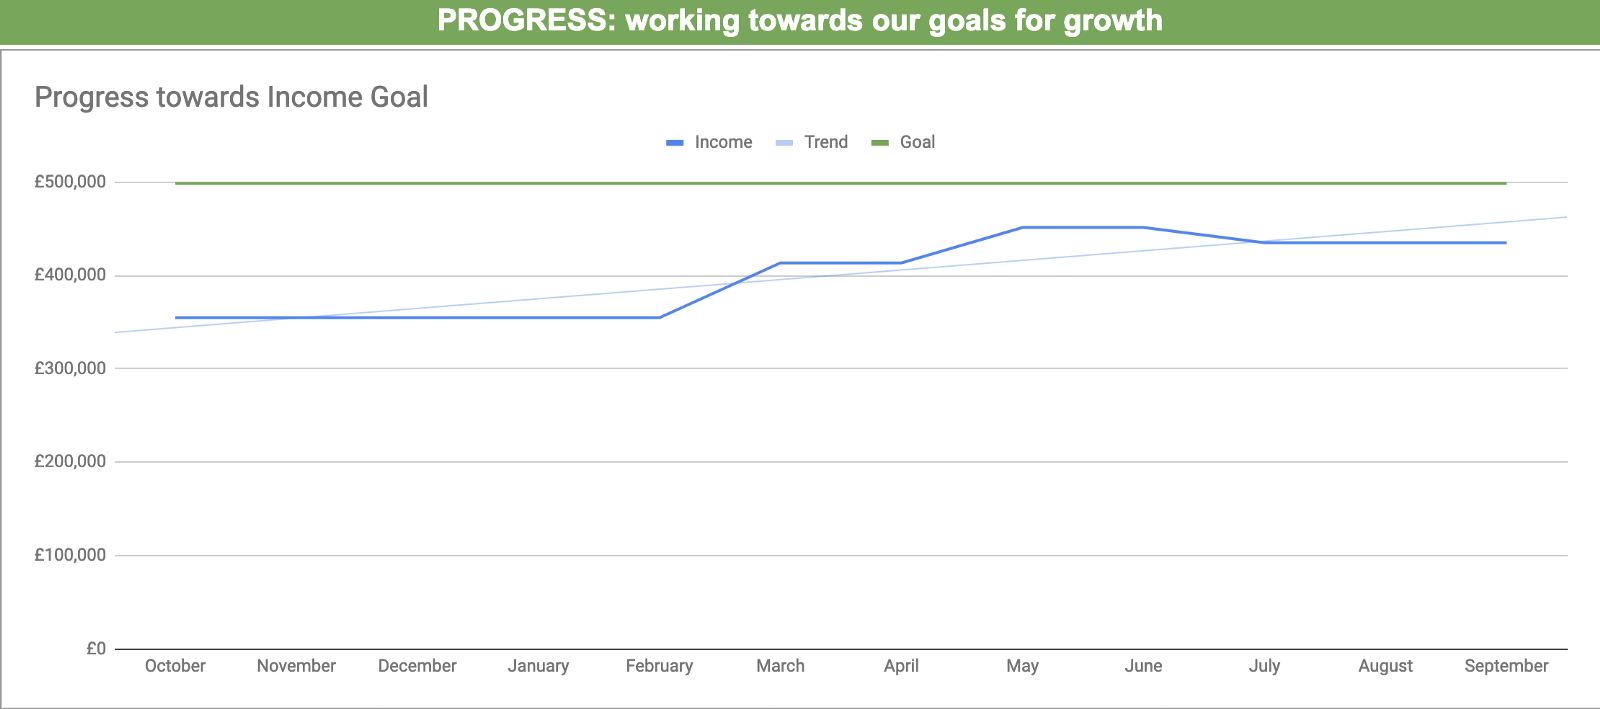
You can then start to have useful discussions about what you can understand from the trend, what can be done to accelerate it, or change it. What can be done to narrow the gap between the forecast and the target? Like with everything on the dashboard, and the forecast, the intention is to start conversations with useful questions.
You can read more about the dashboard in my previous post.
Summary
A financial forecast is most useful when treated like a weather forecast: a regularly updated guess about what the future holds, based on currently held information analysed with your experience and judgement.
Monitoring the trends as you update the forecast is also useful.
In my next blog post in this series, I’ll share our spreadsheet template with you, so you can try it out for yourself.
- Previous Post: A simple agency finance dashboard
- Next Post: Sharing our financial toolkit
If you want to continue the conversation I’m @steveparks on Twitter.
Upcoming Agency Finances Workshop:
Intrigued and want to find out more? Join us for a workshop where you can learn a balanced way to think about agency finances, and develop a dashboard giving your leadership team a clear view of your business.
This post was originally published on our Medium blog at https://blog.weareconvivio.com/healthy-financial-forecasting-6d4c76fcfc37