
Update on government SME spend — it's a smaller cow, AND it's been moved further away
The government has quietly released new data on spend with SMEs — and it‘s not good news
Back in February I wrote about the government’s claims that it was on track for spending £1 in every £3 with SMEs. This didn’t match to the trends I was hearing from a wide range of small businesses, so I decided to dig into the actual National Audit Office reports in search of the truth behind the spin.
In that research I found:
- There was no increase in government spend with SMEs between 2011 and 2015 — despite regular announcements that they had increased spend.
- Instead, the government changed the way they calculate the spend with SMEs four times in that period, in order to show increases. This was dealt with firmly and frankly in a National Audit Office report. Though the government (including civil servants, who should know better) continued to trumpet the bad data, and the press continued to repeat their claims.
- In the most recent change the government added in estimates of the amount of money its big suppliers probably spend with SMEs, and now claims that as part of its own spend with SMEs. Additionally, it doesn’t back-calculate similar assumptions into the old data — as if big suppliers never previously had SME sub-contractors — so that’s where the big rises come from.
So, I found conclusively that claims of a massive (or, indeed, any!) growth in government spending with SMEs were — let’s not beat about the bush with this in these times of Trump and Brexit ‘alternative facts’ — a lie.
My investigation was sparked by receiving a promotional email from HMRC about a seminar that the SME Crown Representative was going to speak at to trumpet this great work by the government on supporting SMEs.
I know the (then) SME Crown Rep a little from many years back, and should start by saying that she’s always been dedicated to supporting small businesses, putting in an enormous amount of energy to do so — including evenings and weekends. This is not someone who coasts in a role like the SME Crown Rep. She’ll put the hard work in. I hope she keeps focused on being the representative of small business to the government, rather than being co-opted into being the representative of government to small business.
A short while after my original blog post I was on a panel with the SME Crown Rep and we discussed my research afterwards. She’d wanted to write a response to my post so had asked the team at the Crown Commercial Service to provide her with some actual data to counter my findings and back up their claims. They weren’t able to.
But then, a few weeks ago I see this tweet:
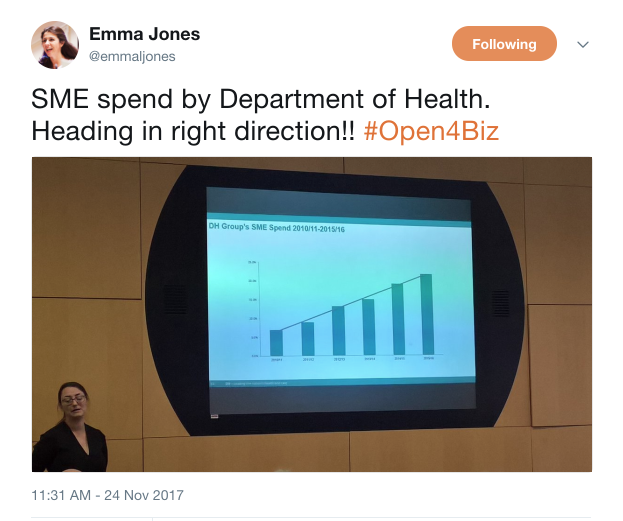
Wow, look at that graph. You couldn’t get a more perfect growth line if you made up the numbers, could you?
And what a political success! When the government came in (initially in coalition), which is where the graph starts, spending with SMEs by the Department of Health was only around 7% — and now it’s well over 20%. Good job! The cow is getting bigger AND closer!
Hmm, but hang on. What’s the source for this data? Let’s zoom in. Odd — there’s no source referenced.
Oh, hang on a data-mangling minute… it couldn’t be that this Department of Health data is based on the same changing assumptions the National Audit Office criticised so strongly, could it? Changing the way the data is calculated four times in five years, but not recalculating the historical data with the same approach, in order to show regular increases?
Say it ain’t so Jeremy, say it ain’t so…
Hmm, I started to have some pretty strong doubts about that beautiful, steadily rising chart.
And that’s when I was contacted by Spend Matters, a procurement industry news site, who pointed me to an article they’d written recently:
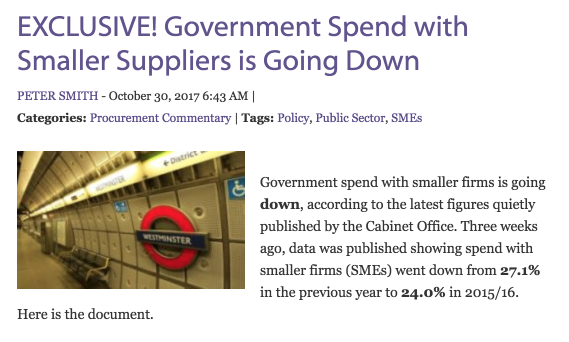
They directed me to this year’s SME spend data, which had been slipped out quietly in October.
Usually there’s a big fanfare around this, with ministers banging out the talking points in interviews, articles in the papers etc.
But this time, rather than trumpet the actual figures, the government chose instead just to release a list of the top 100 SME suppliers to government, and trumpet that instead. The SME Crown Representative then blogged about this angle too.
The government’s approach to spend with SMEs seems — like much else — if we keep pretending things are true even in the face of real data showing otherwise, maybe they will be true?
I prefer to face the facts as they really are, use the truth as a starting point, and work hard to get from there (however bleak that may be) to where we want to be.
Keep this in your bottom drawer for now Smithers
Another interesting point — this is the longest delay in publishing these figures for years. The figures for 2014–15 were published within just 9 months in December 2015! The figures for 2013–14 were published in February 2015, after 11 months.
This time round though, the figures for the period closing March 2016 were held back until October 2017– that’s 19 months!
I guess they needed time to figure out how to report the numbers (see below), and come up with the alternative angle of profiling the 100 top SME suppliers. Also handy that it meant the figures didn’t come out until after the election of course.
What does the SME spend data really show?
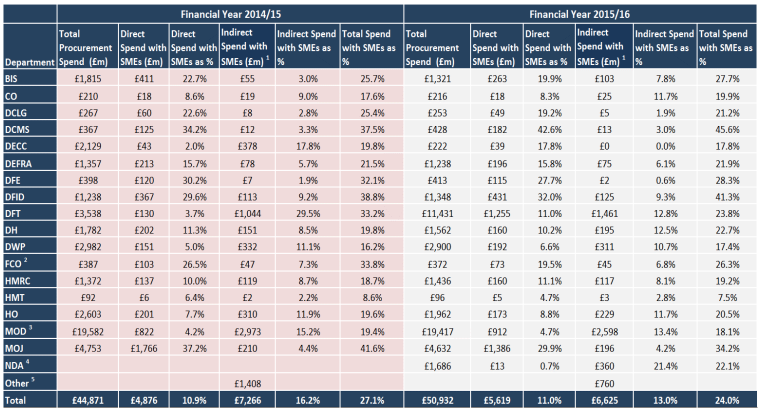
So let’s dig into the data itself. First, let’s look at the real honest numbers of government direct spend with SMEs.
Remember, we’re looking to stand up that graph shown in the tweet above that claims the Department Of Health is now spending well over 20% of its budget with SMEs.
So... let’s see… the actual auditable figures of direct spend with SMEs say the real figure for the Department of Health is 10.2% — down from 11.3% the previous year.
Ok, well, maybe that’s an anomaly. Let’s check some others. Hey, there’s BIS at the top of the list! The Department for Business and Innovation and the letter S! They’re bound to be supporting small business.
Oh.
BIS spending with SMEs has dropped from 22.7% to 19.9%. What’s worse is their overall budget has been slashed, so the actual amount spent with SMEs has fallen from £411m to £263m. That fall in real values is mirrored across many departments.
Wow, Bigly Success Time!
But, scanning down the list, what’s this I see in the figures. An enormous, humungous success story!
The Department for Transport. Wow, look — their spend with SMEs went from just 3.7% to 11%! That’s incredible. And the actual value went from £130m to £1,255m. That’s an enormous leap.
Hmm, that’s interesting. Their total departmental purchasing spend has gone from £3,538m to £11,431m. That’s quite surprising in these times of austerity.
Oh.
Wait.
In the ‘further information’ section at the bottom of this press release CCS reveals, for the first time this year, that the Department for Transport figures include Network Rail. And yes, you guessed it, last year’s figures haven’t been re-calculated to be comparable, but are being used for comparison. They obviously ran out of room to include that footnote in the same document as the actual figures.
Oh dear.
So therefore we know the DfT figures are unreliable. We can’t know how to recalculate them to be comparable, so we have to just take them out of the table for both years and look at the rest of government.
I have my suspicions about a few other bits of small print too:
- The FCO “direct spend is based on UK spend only. Indirect has been calculated against global total procurement spend”. Uhuh, so you’re including what you reckon the FCOs suppliers spend with SMEs worldwide but reporting this to British SMEs as if it’s your spend with them?
- “MoD total procurement and direct spend figures are for the core department only, therefore excluding its Executive Agencies and NDPB.” Uhuh, but they aren’t excluded from the calculation of the indirect spend. Why not? Was one figure inconvenient while the other was convenient.
But I’ll give them the benefit of the doubt on those.
Some Real Data
So, let’s take a look at the totals with just the DfT’s wonky figures removed (across both years) to be able to compare all the other government depts for which there are comparable figures, combined:
2014/15 Direct Spend with SMEs: £4,745m = 11.48%
2015/16 Direct Spend with SMEs: £4,367m = 11.06%
So the spending with SMEs across government is going down year on year in financial terms and percentage terms.
2014/15 Estimated spend by large suppliers with SMEs: £6,222m =15.05 %
2015/16 Estimated spend by large suppliers with SMEs: £5,162m = 13.07 %
And even the government’s own guesstimate of what its big suppliers might be spending with SMEs has gone down, in financial terms and in percentage terms (possibly after a wrist-slap from the NAO the previous year for being too ‘imaginative’).
So now we know why the government needed to delay publication and work on including the Network Rail figures to provide the appearance of it giving a boost to SMEs.
But the reality is that government spend with SMEs is going down by all measures.
The effect of inflation
But it’s also worth noting that the government’s figures don’t take account of inflation.
That £4,745m in the previous year (2014/15) is now actually worth £5,070m — showing the latest figure of £4,367m to be even more of a drop in real terms.
In real terms this is a drop of 14% in one year!
So the fall in spending by government with SMEs is actually even more of a fall in real terms.
Comparing long term progress
Remember back to that Department of Health graph, showing a huge growth since 2010? That kind of sentiment is echoed in all of the government’s press releases, ministers speeches, and so on.
But the National Audit Office itself said that this claim cannot be backed up by the data, because they keep changing what is measured in order to show an increase.
In the year 2011/12 before they started adding all sorts of things in to the measures, the government spent £4,440m with SMEs (a figure the NAO agrees with). That is now actually worth £5,114m in today’s terms.
Even the government-issued recent figures that add in Network Rail to boost the spend only claim the direct spend with SMEs is £5,619m.
But if we drop out the suspect DfT figures, as above — but add back in the spend they reported with SMEs in the previous year before Network Rail started to be included — we have a spend now of £4,497m.
That shows a fairly good estimate that government spending with SMEs, in real terms, has fallen by £617m, or 12%, over the last five years.
And one more thing
In the original press release announcing their targets to ‘spend £1 in every £3’ with SMEs by 2020 there were references to this, obviously, being ‘a third’ of government spending. A third is, I think we can agree, 33% (rounded down).
And in fact, that figure is on the page that releases this year’s data:

But if you look at the actual spreadsheet of data that has been released, you’ll see a whole column that has been omitted from the published table above:
“2020 SME Taget(sic) (Direct and indirect)”
And at the bottom of that column is their total for the target for 2020: 29.7%
So, it seems the government is quietly watering down the targets, while still trumpeting the £1 in every £3 soundbite — and while fudging the data to work up towards them.
Bleak times for facts and honesty in government. Bleak times for government support of SMEs.
Is this approach okay now?
So fellow small business owners — I wonder if the government will let us start reporting our own financial data with this kind of approach?
“Hi HMRC, we’ve estimated that our suppliers have done research and development of £10m this year, so we’re including that in our claims for our own R&D tax credits.”
In Summary
My findings:
- Government spending with SMEs is falling in % terms and in real financial terms.
- Because of cuts to overall department spending each % point is actually worth less in £ anyway, so the effect on SMEs is even harsher.
- In addition, taking inflation into account means the spend is falling even further in real terms.
- Government keeps fiddling the numbers by adding in new things that weren’t measured before to show an increase, in place of the numbers actually increasing.
- Government is quietly watering down the targets.
- Some senior civil servants and the SME Crown Representative are simply repeating the political spin talking points, rather than discussing real data.
- The press seem to (mainly) be happy to simply repeat the headline figures they are given without considering the small print, such as this piece in Computer Weekly: Government IT contracts, are the new kids taking over the block?
- With all the spin being trumpeted, the government doesn’t have to actually do anything that benefits SMEs to get the good headlines. So SMEs lose out.
Things need to change
I call for:
- Statistics of government spend with SMEs must be based only on money they actually spend with SMEs.
- Statistics must be compared like for like. If changes to measurements are made, previous years’ figures must be recalculated to allow honest comparison.
- The government should report spend with Small Businesses and Medium Businesses separately.
- The SME Crown Representative should be prepared to speak out against government acting against the interests of SMEs, rather than being part of the spin.
And finally…
So I’d like to see the SME Crown Representative take up this issue on behalf of UK Small Businesses.
Let’s get the government to measure and report SME spend data honestly.
Fixing a problem starts with admitting it exists. Let’s help the government ‘fess up about this, then get them focused on the reality and how to fix it.
This post was originally published on our Medium blog: https://blog.weareconvivio.com/update-government-sme-procurement-its-a-smaller-cow-and-it-has-been-moved-further-away-87916432f016